Node-red is an easy to use yet powerful drag and drop development platform designed for the Internet of Things. With this nicely wrapped mcp3008 node, we can talk to the A2D chip on the PiShield to easily get data into node-red.
In this example, you will see how to easily get sensor data into node-red with the PiShield.
You will need:
- A network connected Raspberry Pi (any model)
- PiShield with sensors of your choice.
- node-red installed with the mcp3008 node installed (for default installations, goto ~/.node-red folder and type
npm install mcp3008.see node-red documentation for further details on how to install extra nodes) If you have our system image, all the software is already set up and you can simply proceed below:
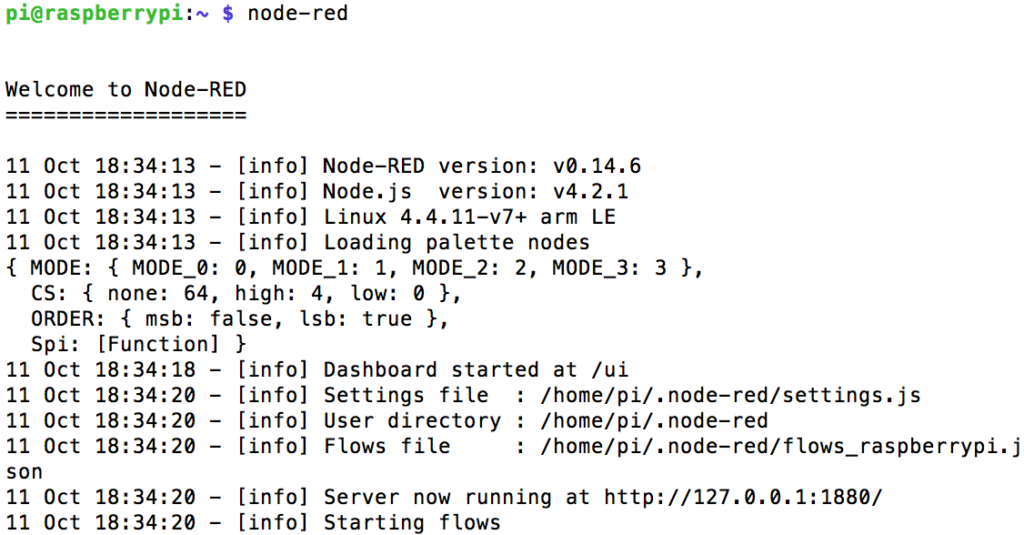
First, ssh into your pi, and then type node-red to start it. You should see something like this:
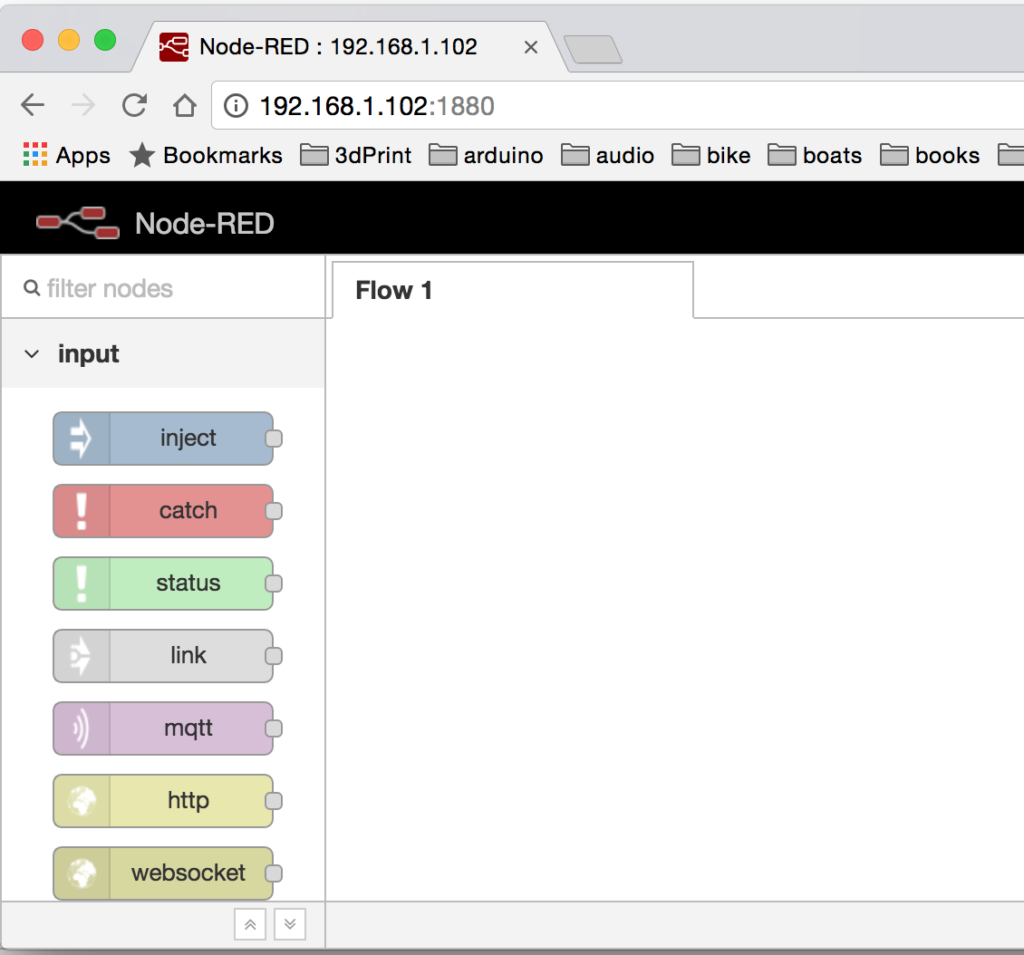
Now that node-red is running, you can open up the node-red interface by opening up a browser, and typing [IP ADDRESS]:1880, or raspberrypi.local:1880, such as:
scroll down the node palette on the left until you see the “mcp3008” node. Place drag and drop it on screen, and add two “inject” nodes with the strings “start” and “stop”:
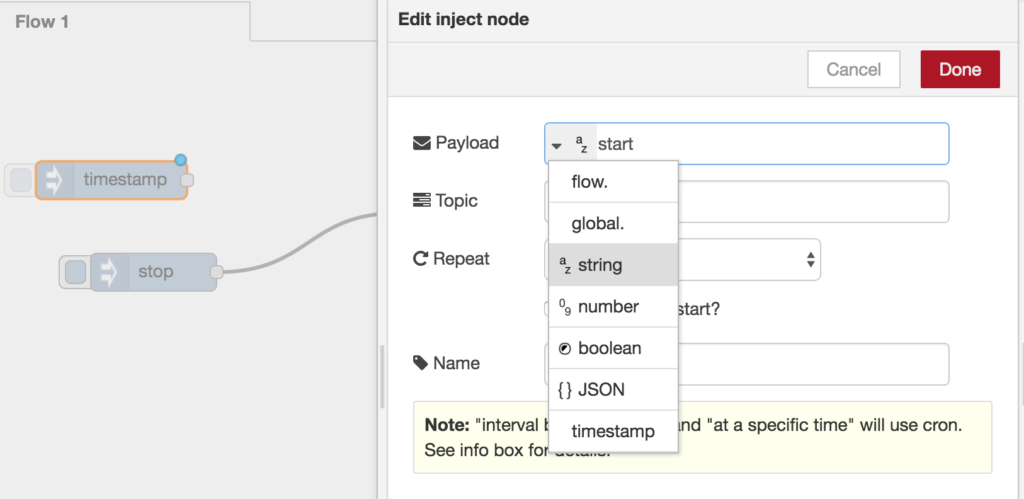
By default, the inject node shows up as a timestamp. To modify it, double click and then change the payload type to “string”. You can then define the value accordingly.
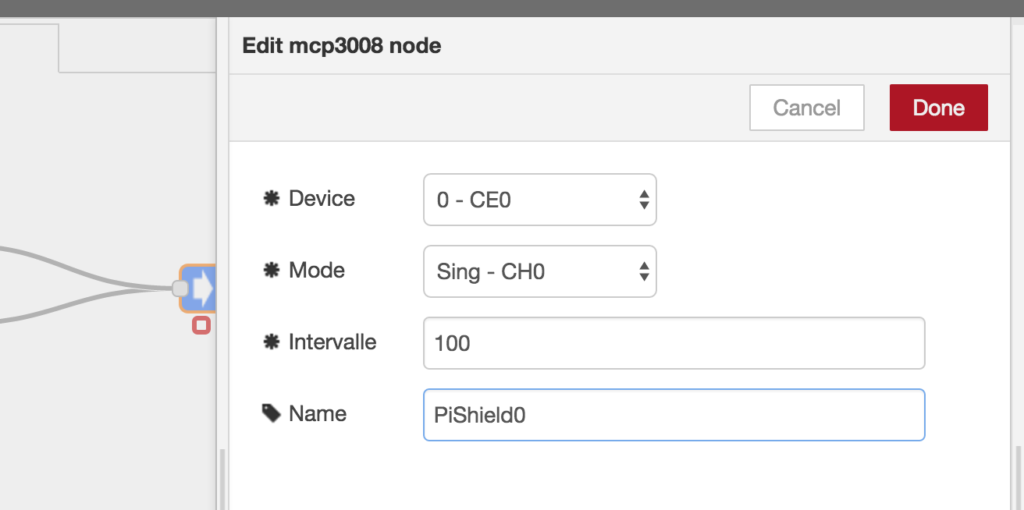
If you double-click on the blue mcp3008 node, you can set options such as the channel, polling rate (in milliseconds), and name of the node:
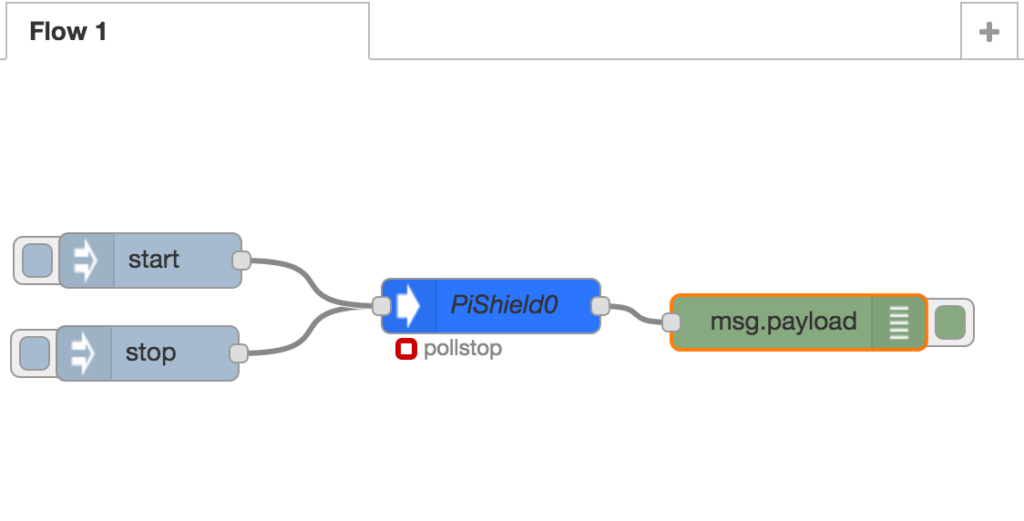
Finally, add a debug output node to display the data from the sensor. Your flow should look something like this:
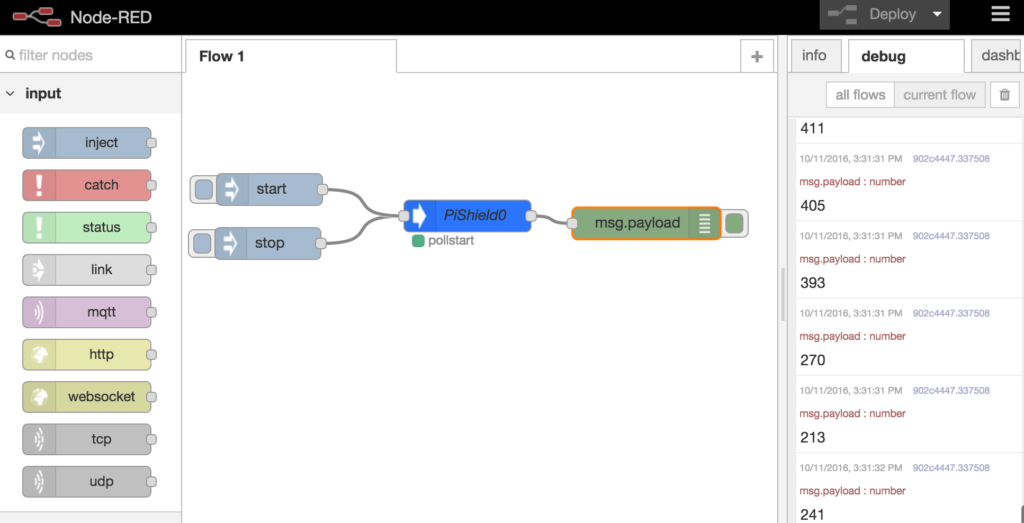
Now, hit the red “deploy” button at the top right, and then press on the round square button next to the “start” inject node. You should see sensor data being displayed in the debug console tab:
In the next example, we will see how to create a pretty looking dashboard for your sensor data!