Difference between revisions of "Link-14 Analysis"
| Line 10: | Line 10: | ||
| − | == | + | ==Analysis== |
[[File:link-14_analysis.png]] | [[File:link-14_analysis.png]] | ||
| + | |||
| + | |||
| + | ==Plot== | ||
| + | |||
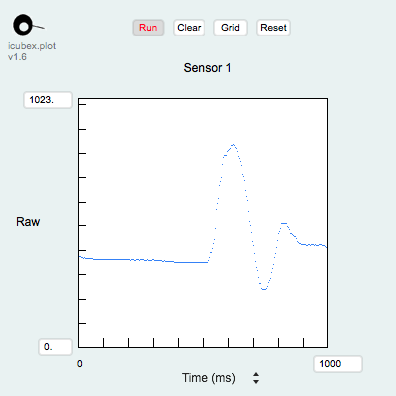
[[File:link-14_plot.png]] | [[File:link-14_plot.png]] | ||
| + | |||
| + | |||
| + | ==Calibration== | ||
| + | |||
[[File:link-14_calibration.png]] | [[File:link-14_calibration.png]] | ||
[[File:link-14_calibration_record.png]] | [[File:link-14_calibration_record.png]] | ||
Revision as of 06:00, 12 December 2016
The analysis window provides calibration and data display tools, enabling you to gain a an accurate understanding of the sensor's output.
Contents
Access
From the main window, click the "edit" button to open its configuration window. Click the area below the "edit" button to enable/disable calibration.
Analysis
Plot


