Difference between revisions of "Widig-802 QuickStart WiFi"
(→Further steps) |
|||
| Line 33: | Line 33: | ||
==Further steps== | ==Further steps== | ||
| + | |||
| + | Note that changing the WiDig configuration via USB with Connect or other software is (mostly) not reflected in the WiDig configuration web page. Reload the page to update it and show the current state after any changes effectuated in Connect or other software. | ||
<b>Sensors</b> | <b>Sensors</b> | ||
Revision as of 13:06, 14 March 2019
Connect the WiDig
Out of the box, once powered with the USB battery or via the USB connection to a computer, the WiDig sets up a WiFi access point (AP).
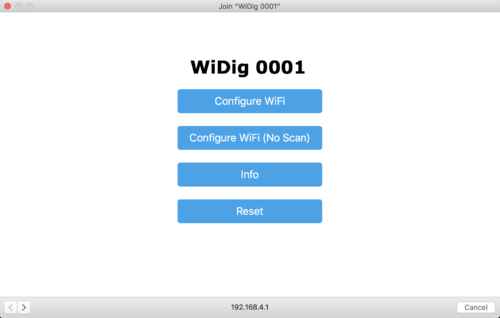
1. Find the WiDig AP in the list of access points in your WiFi menu and connect to it. The WiDig will be listed as "WiDig SSSS", where SSSS is its serial number.
A "captive portal" window will open entitled "Join WiDig SSSS". If you don't select the AP in the list manually, the captive portal will open eventually automatically.
2. Start an OSC monitor (eg. using the software that you plan to send the WiDig sensor data to, or this OSC Data Monitor) and configure it to listen for messages on port 9999, or run an IP/WiFi/LAN/network scanner (eg. Trendmicro's Housecall for Home Networks or, for mobile devices, Fing, and there are many others), or start a web browser and access the configuration page of your network's router.
3. Select "Configure WiFi" and in the following screen select the network you want to use and enter its password. The WiDig now has the necessary credentials to be able to obtain an IP address. Once it has obtained this IP address it will send an Open Sound Control (OSC) message to all computers on the network on port 9999 with this IP address. The WiDig sends this OSC message with its IP each time it is powered up or re-booted. Alternatively you can find the WiDig's IP address in the list of connected devices provided by the IP/WiFi/LAN/network scanner or on the configuration page of your network's router, by looking for the WiFi chip's manufacturer name "Espressif".
4. Enter the IP address in the URL field of a web browser (on a computer or on a mobile device) to access the configuration page of the WiDig.
5. Connect a Turn sensor to input 1.
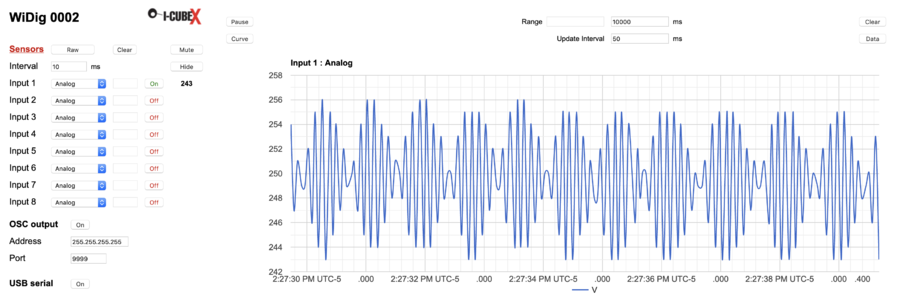
6. Click on the "Off" button of Input 1 to start streaming sensor data of Input 1 and confirm that you are receiving this data in OSC-capable software and/or in the OSC monitor.
You're up and running !
Further steps
Note that changing the WiDig configuration via USB with Connect or other software is (mostly) not reflected in the WiDig configuration web page. Reload the page to update it and show the current state after any changes effectuated in Connect or other software.
Sensors
1. Select the sensor type you have plugged into the WiDig's input from the pull-down menu.
2. When selecting a digital I2C sensor, the field to its right will be enabled for entering the sensor method, if needed.
3. Switch between raw and processed modes of operation by clicking the raw/processed button. The raw mode corresponds to host mode (see eg. Connect), while the processed mode corresponds to standalone mode. With EditorX you can configure more features of the processed mode than possible with the web browser page.
4. Click "Show" (which then changes to "Hide") to see the values of the sensors that are enabled, and start collecting sensor data for display in a chart. Click "Hide" to disable this, and stop collecting sensor data for display in a chart. All sensor data collected thus far is still kept in the browser memory.
5. Click on a sensor value to view it change over time in a chart that will open to the right. Close the chart by clicking the sensor value again. Closing the chart doesn't delete any sensor data, and its values continue to be collected as long as the sensor is enabled and as long as the "Show"/"Hide" button is set to "Hide". Click on the sensor value of another sensor to see its data (since it was enabled or since the "Show"/"Hide" button was set to "Hide", whichever last occurred) in a chart instead.
6. Click "Curve" (which then changes to "Dots") to switch to viewing the actual sensor values as dots. When set to "Curve" a smooth line is interpolated between the sensor values. Beware that this is a mathematical interpolation, ie. values of the curve between the actual sensor values (as seen in the "Dots" mode) may not be accurate.
7. Change the value to the far right of "Range" to set the time span (in milliseconds) of the chart.
8. Click "Pause" (which then changes to "Scroll") to stop the chart from scrolling. Pausing the chart doesn't stop the receipt of sensor values. Then change the two values next to "Range" to select a time span to view in the chart. These values are the absolute time in milliseconds since January 1, 1970 at 00:00:00 GMT. Hover over sensor values in the chart to see the time represented in a more readable format. The timeline at the bottom display time in yet another time format.
9. Change the value to the right of "Update Interval" to set the interval between the receipt of successive sensor values. This value is independent of the sampling interval and setting it lower than the sampling interval has no use. Setting it higher than the sampling interval will result in sensor values not shown in the chart. The transmission of sensor data at very high sampling rates (sampling interval less than 10 ms) and update rates (update interval less than 10 ms) may depend on the quality of the WiFi network. The chart is updated at a rate independent of the previous two update rates, where its update interval is equal to the "Update Interval" with a minimum of 20 ms.
10. Done with collecting data ? Click "Data" to save all the sensor values collected since the sensor value under "Show"/"Hide" was clicked. If the chart scrolling is paused and/or the sensor is still enabled, the last received sensor value just before clicking the "Data" button will be included in the file. Beware that if the "Update Interval" value is higher than the sampling interval, not all sampled values will have been sent from the WiDig to the web page and hence not all sampled values will be included in the saved data file.
11. In the Chart section, click "Clear" to reset the chart, delete all its data and start again. This action only applies to the selected sensor and all other data from enabled sensors is still being collected. Reloading the web page will delete all data.
12. In the Sensors section the "Clear" button to set the configuration of all input/output slots of the WiDig that are not used by digital I2C actuators to default values for sensors.
13. Click on the "Sensors" link (which then changes to "Actuators") to access the configuration page for actuators (see below).
Actuators
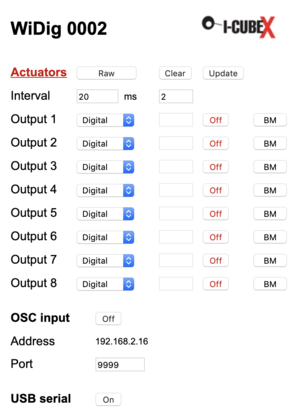
1. Click the "Actuators" link to access the configuration page for sensors (see above).
2. Select the actuator type you have plugged into the WiDig's output from the pull-down menu.
3. When selecting a digital I2C actuator, the field to its right will be enabled for entering the actuator method, if needed.
4. When enabling the pulse-width modulation of a digital binary actuator by clicking the button "BM" (it'll change to "PWM") enter the PWM value in the field to the left of the On/Off button.
5. If PWM is set for any of the actuators, change the pulse interval with the field to the right of "Interval". Change the pulse width range with the field to its right. The default setting of 20 ms for the pulse interval and 2 ms for the pulse width range is compatible with most RC servos. The 2 ms range is actually 1-2 ms. When setting the range to 3 ms (or higher) it represents 0-3 ms (or higher). Note that the Pulse interval always has to be 3 ms higher than the pulse width range.
6. The "Update" button in the actuators page allows you to see the status of the outputs if they are controlled by OSC messages or have been set via USB using a software program.
7. Click the "Clear" button to set the configuration of all input/output slots of the WiDig that are not used by digital I2C sensors to default values for actuators.
OSC
1. Configure the OSC output and input addresses and ports as needed. Out of the box the OSC output is configured to broadcast to the entire network but you may want to change that to send OSC messages to a specific computer's IP address.
2. To maximize performance and minimize latency of OSC messaging, disable the display of data in a chart by setting the "Hide"/"Show" button in the Sensors section to "Show".
3. If working via USB and if you don't need OSC messaging, maximize performance and minimize latency even further by turning off any OSC messaging by setting the "On"/"Off" button to "Off".


