Link-14 Analysis
The analysis window provides calibration and data display tools, enabling you to gain a more accurate understanding of the sensor's output.
Contents
Access
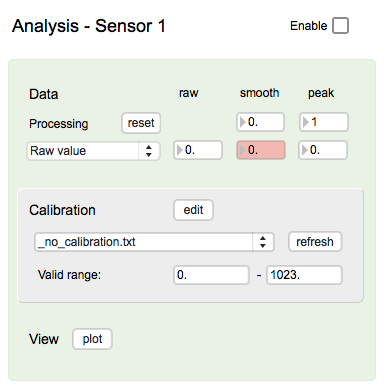
From the main window, click the "edit" button to open its configuration window. Click the area below the "edit" button to enable/disable calibration.
Analysis
The analysis window, in the data section, shows the current sensor value (if Raw Value is selected) or its calibrated value (if one of its entries on the pull-down menu is chosen, and the Enable box is checked), its smoothed value as per the smoothing parameter and peak value given the window size in milliseconds. By clicking on one of the three values, the number box is colored red and it is this value that is shown in the graphical plot (if opened). In the calibration section, the selected calibration and the range of sensor values for which the selected calibration is valid, is shown.
Plot
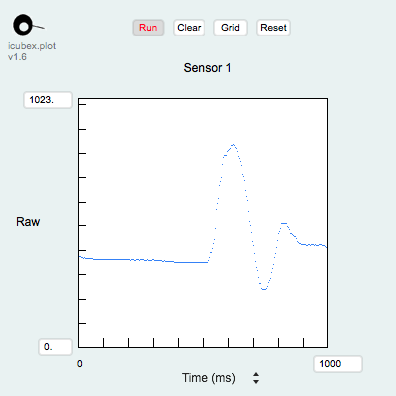
The plot window displays the currently sampled sensor data (raw, smoothed or peak value, as per the selection in the main analysis window). Change the range on the vertical axis by entering a number in the number box or dragging it. Change the time scale by selecting a range from the pull-down menu or by entering a number in the number box or dragging it. Note that the time scale resolution is 250 ms.
Calibration
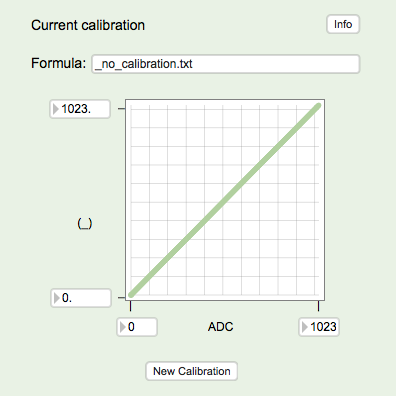
The calibration window shows the currently loaded calibration data.
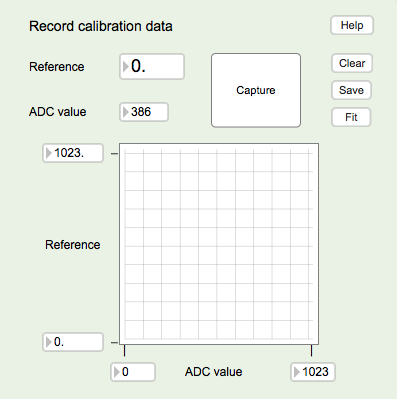
For making a new calibration, please refer to the help file.


